The group has developed a Muon Hodoscope apparatus for the purpose of undergraduate teaching and educational public engagement.
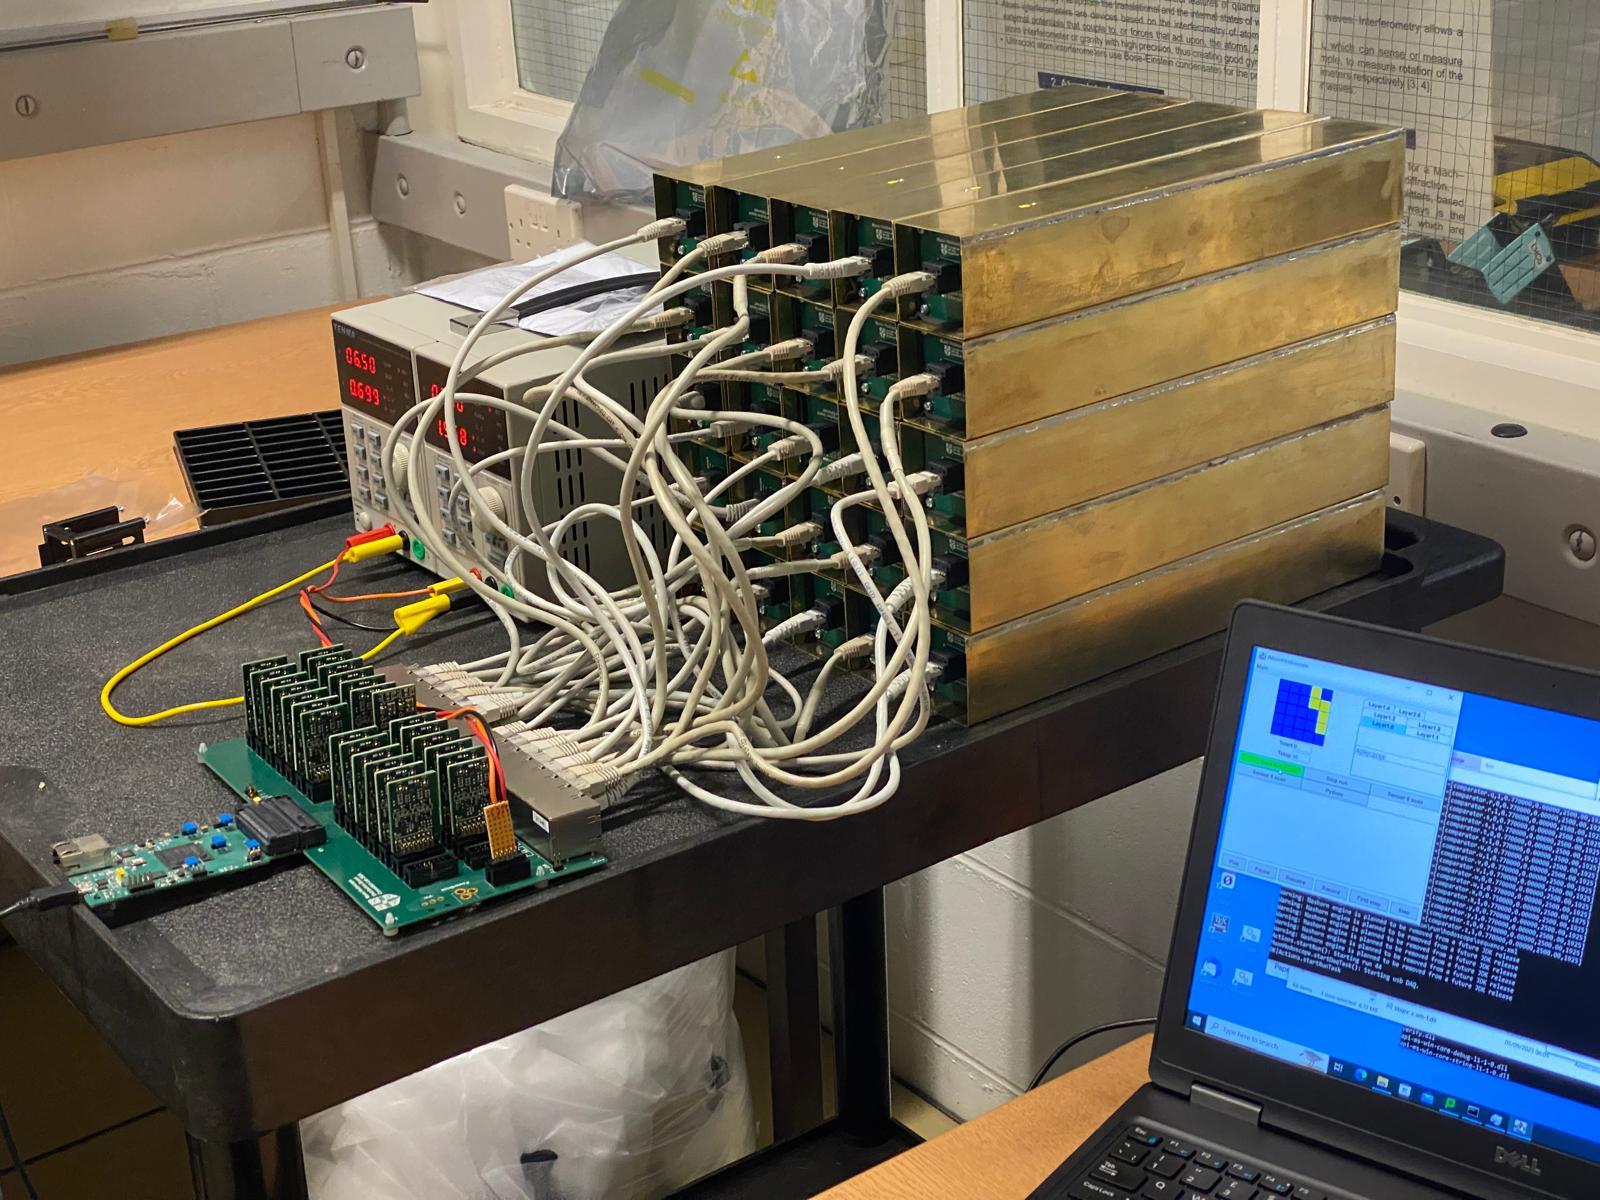
The apparatus comprises a 5 by 5 stack of scintillator bars, each bar having a square cross-section with 5cm side and 25 cm in length.
The scintillation light produced in a bar by the passage of a charged particle is sensed by single-photon-sensitive Silicon Photomultipliers and digitised in a custom electronics chain.
The path of cosmic ray muons (naturally occurring charged particles travelling at speeds close to the speed of light) is therefore revealed by the pattern of light produced as the muon traverses the stack of bars. Some examples are shown below where each yellow square indicates that a flash of light was seen in the scintillator bar at that location. Hover over the image to pause the slideshow.
Muon lifetime
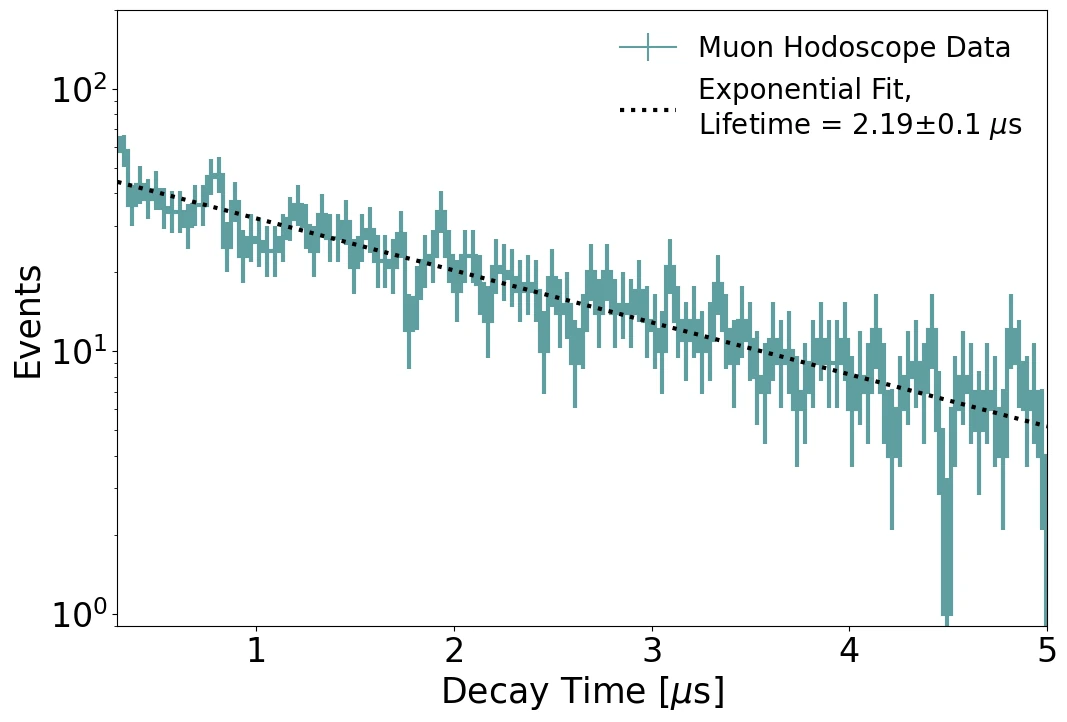
The apparatus measures the muon arrival time with sufficient precision that the muon lifetime can be measured. Muons at rest decay into electrons and have a characteristic lifetime of about 2 millionths of a second (2μs). The difference between the muon arrival time and the delayed signal from the electron follows a distribution that can be predicted from statistical theory. Comparing the predicted distribution with the measurements allows the lifetime to be extracted using a "best fit" method.
Detector calibration
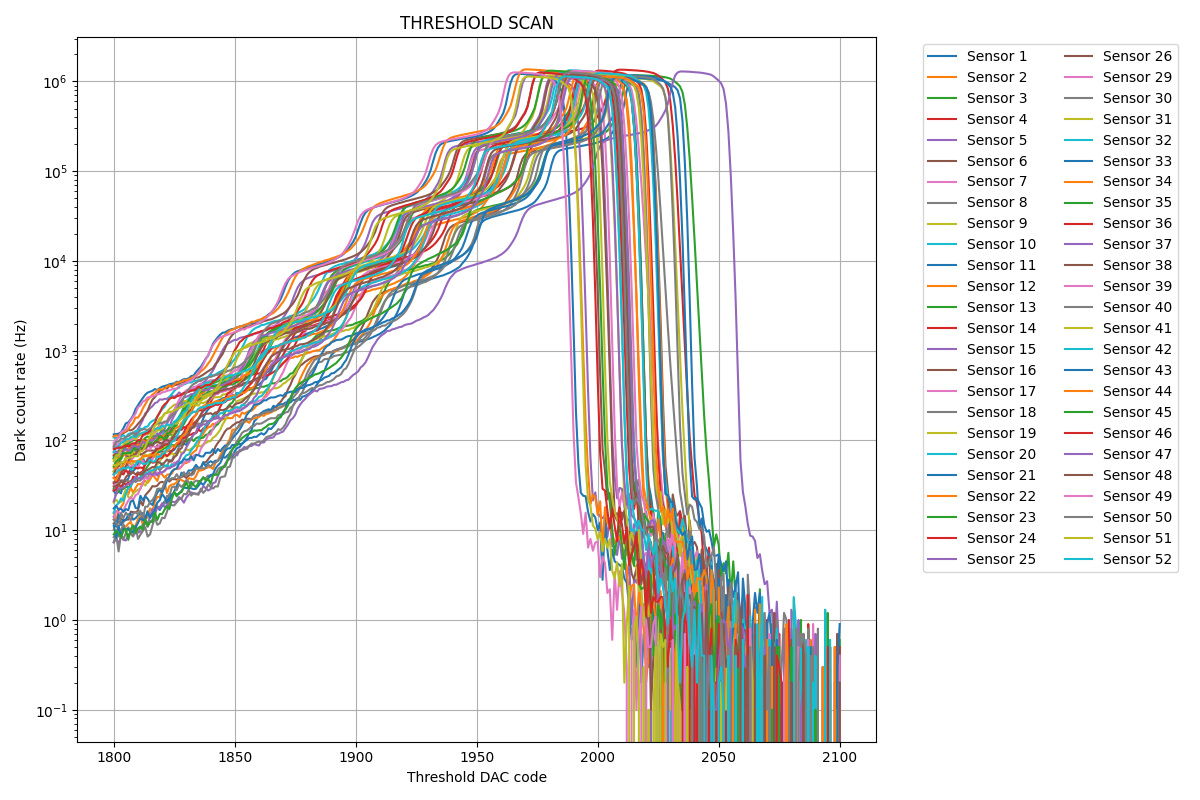
The apparatus relies on very sensitive light sensors that are capable of detecting single photons. Their operating conditions must be carefully controlled in order to reliably detect the feeble light pulses produced in the scintillators. Most important is the tuning of the threshold above which a signal from the sensor is deemed to have been produced by scintillation light and not by other sources such as electronic or thermal noise. A suitable operating point can be found by measuring the amount of noise (mostly "dark counts" due to thermal effects) seen in each sensor as a function of the threshold.
The plot below shows the dark count rate as a function of the applied threshold for each sensor overlayed on the same plot. There are two sensors in each of the 25 scintillator bars. The vertical scale is logarithmic so that the variation in rate over many powers of 10 can be seen. The plots display a step-like pattern for each sensor which is characteristic of silicon photomultipliers. The steps occur at threshold intervals equivalent to the amplitude of the signal from a single photon illustrating the exceptional sensitivity of these devices.