ILD LoI Performance/Optimisation Figures
Optimisation Section
- Figure 2.2-1: PFA performance versus HCAL Depth:
(.eps)
(.pdf)
(.gif)
(.C)
- Figure 2.2-2a: PFA performance versus B:
(.eps)
(.pdf)
(.gif)
(.C)
- Figure 2.2-2b: PFA performance versus ECAL Inner Radius:
(.eps)
(.pdf)
(.gif)
(.C)
- Figure 2.2-3a: PFA performance versus TPC Drift Length (barrel)
(.eps)
(.pdf)
(.gif)
(.C)
- Figure 2.2-3b: PFA performance versus TPC Drift Length (all)
(.eps)
(.pdf)
(.gif)
(.C)
- Figure 2.2-4a: PFA performance ECAL segmentation:
(.eps)
(.pdf)
(.gif)
(.C)
- Figure 2.2-4b: PFA performance HCAL segmentation:
(.eps)
(.pdf)
(.gif)
(.C)
- Figure 2.3-5: Pair backgroundn:
(.pdf)
(.gif)
- Figure 2.4-6a: GLD/GLDPrime/GLD4GLD momentum resolution
(.eps)
(.pdf)
(.gif)
(.C)
- Figure 2.4-6b: GLD/GLDPrime/GLD4GLD momentum resolution ratio
(.eps)
(.pdf)
(.gif)
(.C)
- Figure 2.4-7a: GLD/GLDPrime/GLD4GLD impact parameter resolution
(.eps)
(.pdf)
(.gif)
(.C)
- Figure 2.4-7b: GLD/GLDPrime/GLD4GLD impact parameter resolution ratio
(.eps)
(.pdf)
(.gif)
(.C)
- Figure 2.4-7c: GLD/GLDPrime/GLD4GLD impact parameter resolution vs angle
(.eps)
(.pdf)
(.gif)
(.C)
- Figure 2.4-7d: LDCPrime/GLDPrime impact parameter resolution vs pT
(.eps)
(.pdf)
(.gif)
(.C)
- Figure 2.5-8a: Flavour tagging effic. vs. purity (GLD models)
(.eps)
(.pdf)
(.gif)
(.C)
- Figure 2.5-8b: Flavour tagging effic. vs. purity (LDC models)
(.eps)
(.pdf)
(.gif)
(.C)
- Figure 2.6-9a: Higgs recoil: mumuX
(.eps)
(.pdf)
- Figure 2.6-9b: Higgs recoil: eeX
(.eps)
(.pdf)
- Figure 2.6-10a: GLD/GLDPrime/GLD4GLD/LDCPrime pi zero mass
(.eps)
(.pdf)
(.gif)
(.C)
- Figure 2.6-10b: GLD/GLDPrime/GLD4GLD/LDCPrime pi zero mass
(.eps)
(.pdf)
(.gif)
(.C)
- Figure 2.6-11a: GLD/GLDPrime/GLD4GLD chargino mass
(.eps)
(.pdf)
(.gif)
(.C)
- Figure 2.6-11a: GLD/GLDPrime/GLD4GLD W-boson energy
(.eps)
(.pdf)
(.gif)
(.C)
Performance Section
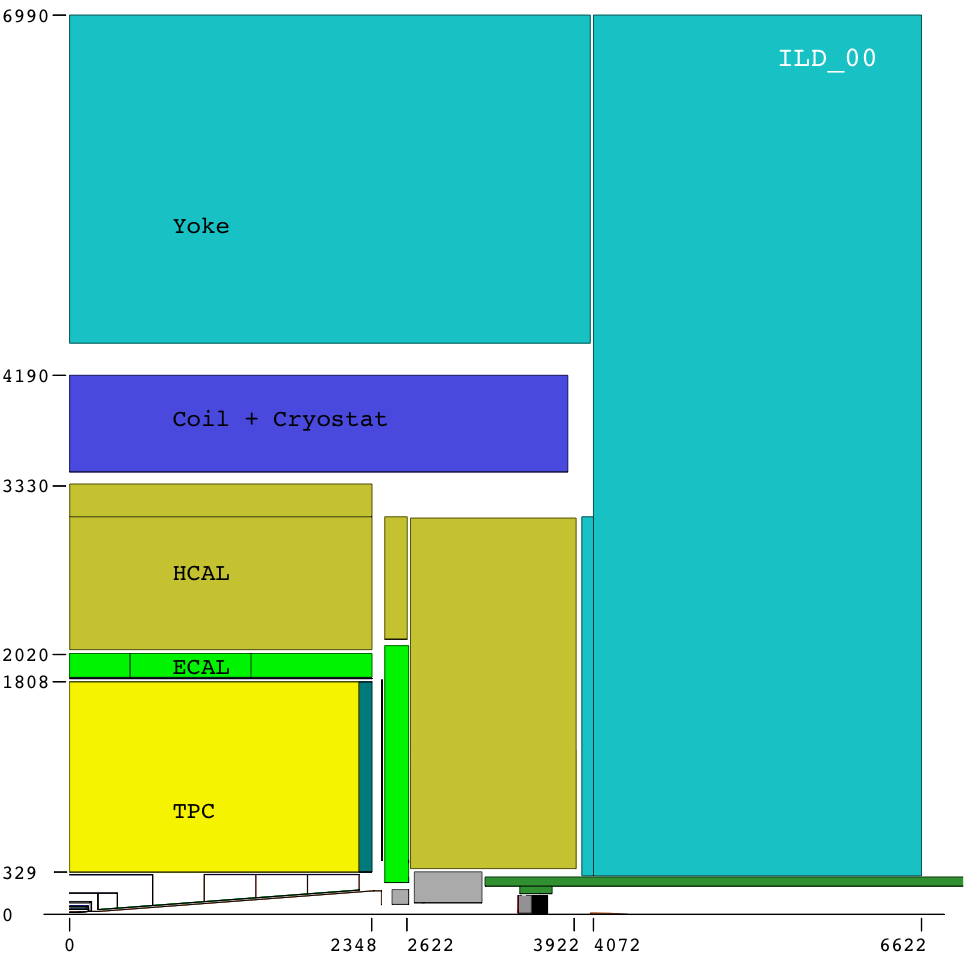
- Figure 3-1a: ILD Quadrant:
(.pdf)
(.png)
- Figure 3-1a black and white (PFA paper version) ILD Quadrant:
(.eps)
(.gif)
(.C)
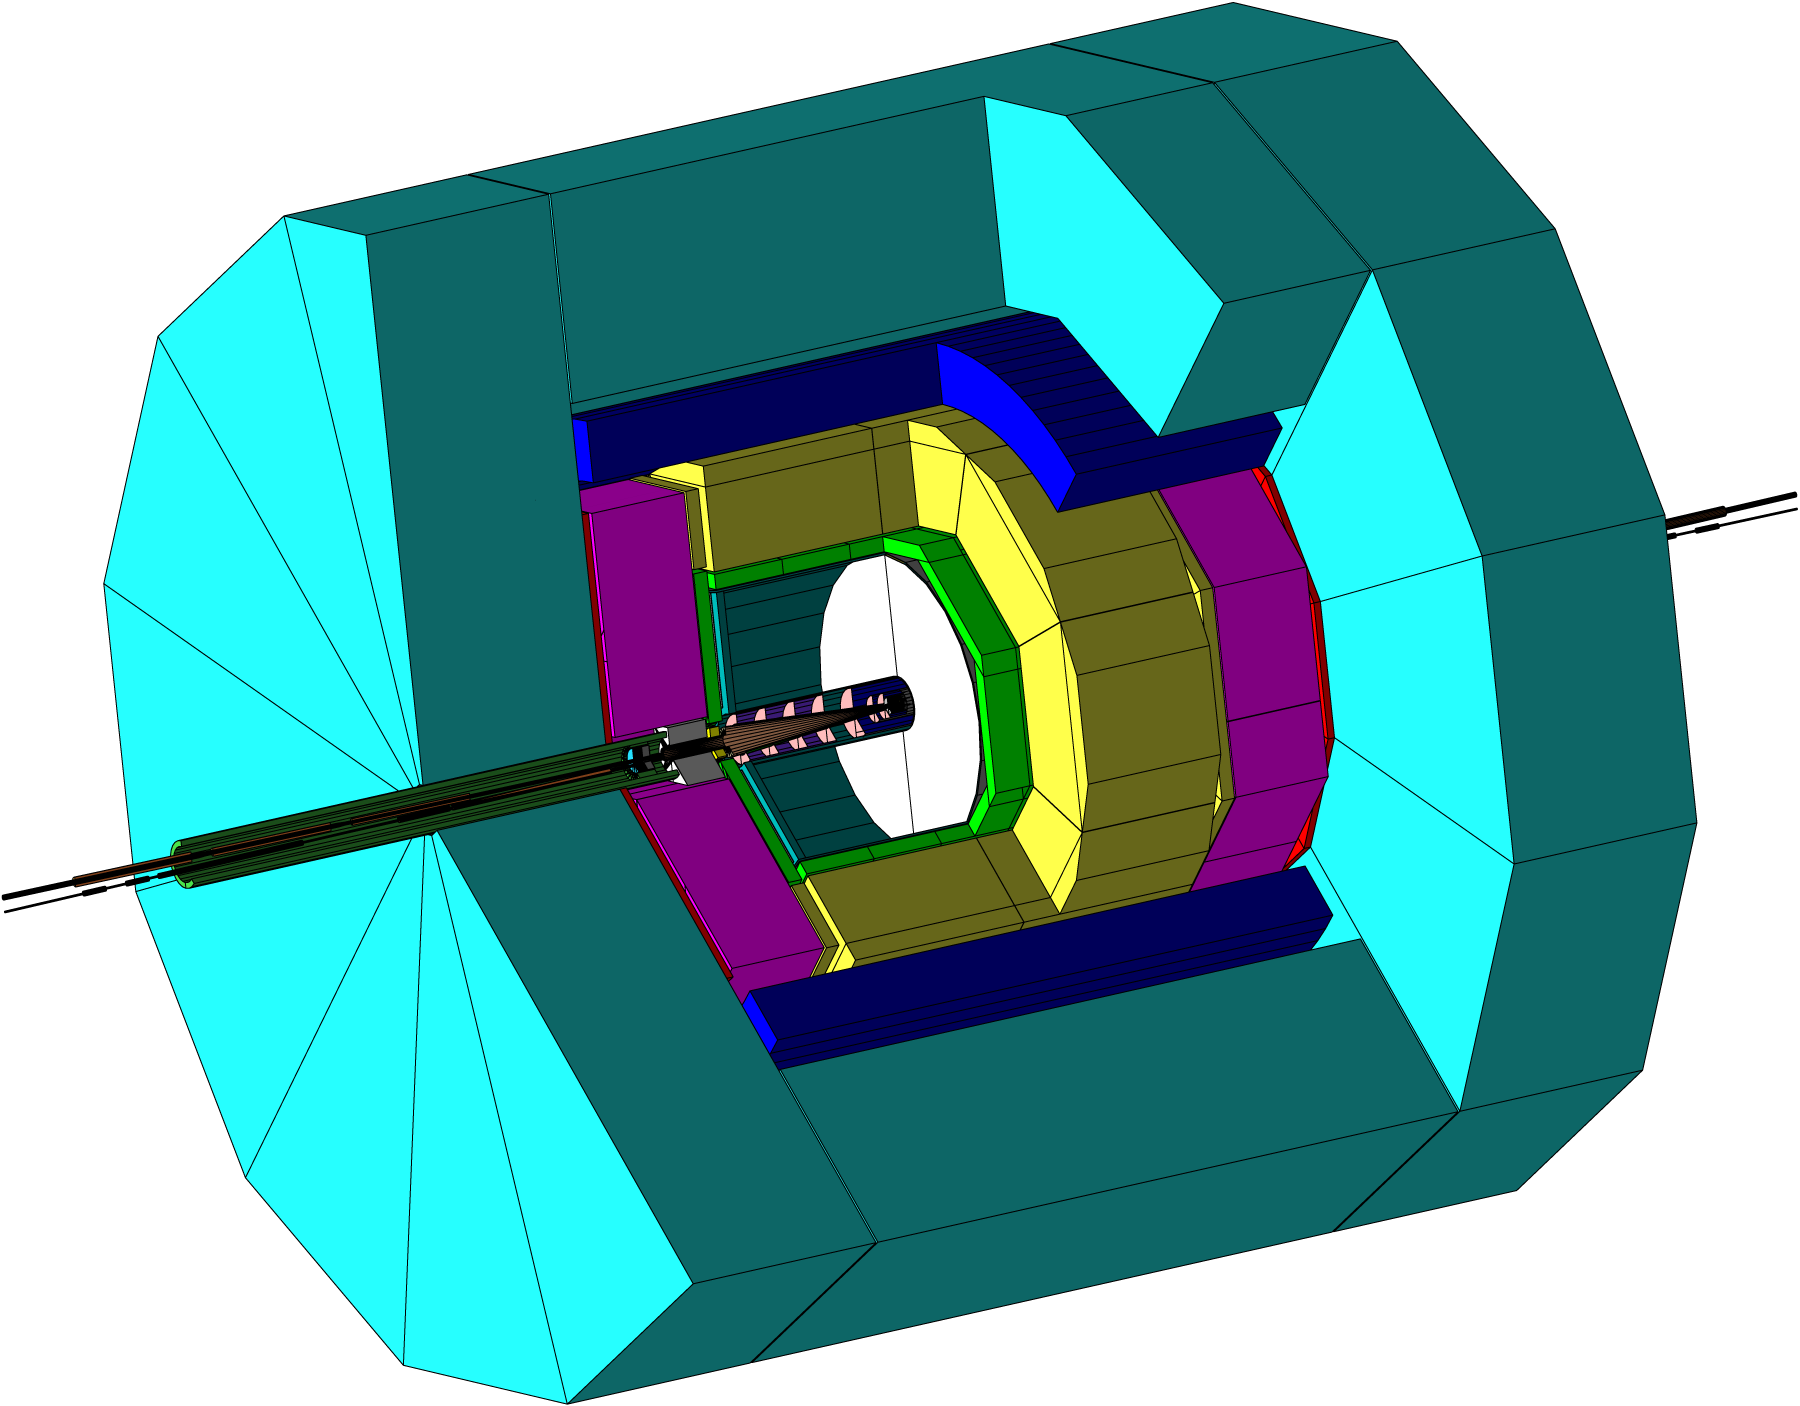
- Figure 3-1b: ILD 3D:
(.pdf)
(.png)
- Figure 3.2-2a: ILD Tracker hits
(.eps)
(.pdf)
(.gif)
(.C)
- Figure 3.2-2b: ILD radiation lengths
(.eps)
(.pdf)
(.gif)
(.C)
- Figure 3.2-3a: ILD momentum resolution
(.eps)
(.pdf)
(.gif)
(.C)
- Figure 3.2-3b: ILD impact parameter resolution
(.eps)
(.pdf)
(.gif)
(.C)
- Figure 3.2-4a: ILD Track finding efficiency versus P
(.eps)
(.pdf)
(.gif)
(.C)
- Figure 3.2-4b: ILD Track finding efficiency versus P
(.eps)
(.pdf)
(.gif)
(.C)
- Figure 3.2-5a: TPC Background : simulated tracker hits (rz)
(.pdf)
- Figure 3.2-5b: TPC Background : simulated tracker hits (rphi)
(.pdf)
- Figure 3.2-6a: TPC Background : tracker hits to Patrec (rz)
(.pdf)
- Figure 3.2-6b: TPC Background : tracker hits to Patrec (rphi)
(.pdf)
- Figure 3.2-7a: TPC Background : reconstructed tracks (rz)
(.pdf)
- Figure 3.2-7b: TPC Background : reconstructed tracks (rphi)
(.pdf)
- Figure 3.2-8a: VTX Background : ghost tracks
(.eps)
(.pdf)
(.gif)
(.C)
- Figure 3.2-8b: VTX Background : ghost tracks after BX identification
(.eps)
(.pdf)
(.gif)
(.C)
- Figure 3.2-9a: VTX Background : tracking efficiency
(.eps)
(.pdf)
(.gif)
(.C)
- Figure 3.2-9b: VTX Background : tracking efficiency for tracks which reach TPC
(.eps)
(.pdf)
(.gif)
(.C)
- Figure 3.2-10: Recoil mass with background
(.eps)
(.pdf)
(.gif)
(.C)
- Figure 3.2-11a: ILD Flavour tag effic. vs. purity (91 GeV)
(.eps)
(.pdf)
(.gif)
(.C)
- Figure 3.2-11b: ILD Flavour tag effic. vs. purity (500 GeV)
(.eps)
(.pdf)
(.gif)
(.C)
- Figure 3.2-12: ILD Particle Flow
(.eps)
(.pdf)
(.gif)
(.C)
- Figure 3.3-13a: ILD Higgs recoil mass (mumuX)
(.eps)
(.pdf)
(.gif)
(.C)
- Figure 3.3-13b: ILD Higgs recoil mass (eeX)
(.eps)
(.pdf)
(.gif)
(.C)
- Figure 3.3-14a: ILD Higgs recoil mass (eeX no Brem/No Brem)
(.eps)
(.pdf)
(.gif)
(.C)
- Figure 3.3-14b: ILD Higgs recoil mass (eeX with Brem recocovery)
(.eps)
(.pdf)
(.gif)
(.C)
- Figure 3.3-15: generated vs. reconstructed mumuX recoil mass
(.eps)
(.pdf)
(.gif)
(.C)
- Figure 3.3-16: Higgs BR templates
(.eps)
(.pdf)
(.gif)
(.C)
- Figure 3.3-17a: Higgs BR qqcc
(.eps)
(.pdf)
(.gif)
(.C)
- Figure 3.3-17b: Higgs BR qqvv
(.eps)
(.pdf)
(.gif)
(.C)
- Figure 3.3-18a: 1-prong tau mass
(.eps)
(.pdf)
(.gif)
(.C)
- Figure 3.3-18a: Ptau (tau->pi)
(.eps)
(.pdf)
(.gif)
(.C)
- Figure 3.3-19a: SUSY Point 5: mass distribution
(.eps)
(.pdf)
(.gif)
(.C)
- Figure 3.3-19b: SUSY Point 5: fitted mass distribution
(.eps)
(.pdf)
(.gif)
(.C)
- Figure 3.3-19c: SUSY Point 5: W boson energy
(.eps)
(.pdf)
(.gif)
(.C)
- Figure 3.3-19d: SUSY Point 5: Z boson energy
(.eps)
(.pdf)
(.gif)
(.C)
- Figure 3.3-20a: Top mass (fully-hadronic)
(.eps)
(.pdf)
(.gif)
(.C)
- Figure 3.3-20b: Top mass (semi-leptonic)
(.eps)
(.pdf)
(.gif)
(.C)
- Figure 3.3-21: Top quark AFB
(.eps)
(.pdf)
(.gif)
(.C)
- Figure 3.3-22a: WWvv/ZZvv mass plot (2D)
(.eps)
(.pdf)
(.gif)
(.C)
- Figure 3.3-22b: WWvv/ZZvv average mass plot
(.eps)
(.pdf)
(.gif)
(.C)
- Figure 3.3-23a: SPS1a' muon momentum
(.eps)
(.pdf)
(.gif)
(.C)
- Figure 3.3-23b: SPS1a' di-muon mass
(.eps)
(.pdf)
(.gif)
(.C)
- Figure 3.3-24a: SPS1a' stau mass
(.eps)
(.pdf)
(.gif)
(.C)
- Figure 3.3-24b: SPS1a' stau spectrum
(.eps)
(.pdf)
(.gif)
(.C)
- Figure 3-1a: ILD Quadrant:
(.pdf)
(.png)
- Figure 3-1a black and white (PFA paper version) ILD Quadrant: (.eps) (.gif) (.C)
- Figure 3-1b: ILD 3D: (.pdf) (.png)
- Figure 3.2-2a: ILD Tracker hits (.eps) (.pdf) (.gif) (.C)
- Figure 3.2-2b: ILD radiation lengths (.eps) (.pdf) (.gif) (.C)
- Figure 3.2-3a: ILD momentum resolution (.eps) (.pdf) (.gif) (.C)
- Figure 3.2-3b: ILD impact parameter resolution (.eps) (.pdf) (.gif) (.C)
- Figure 3.2-4a: ILD Track finding efficiency versus P (.eps) (.pdf) (.gif) (.C)
- Figure 3.2-4b: ILD Track finding efficiency versus P (.eps) (.pdf) (.gif) (.C)
- Figure 3.2-5a: TPC Background : simulated tracker hits (rz) (.pdf)
- Figure 3.2-5b: TPC Background : simulated tracker hits (rphi) (.pdf)
- Figure 3.2-6a: TPC Background : tracker hits to Patrec (rz) (.pdf)
- Figure 3.2-6b: TPC Background : tracker hits to Patrec (rphi) (.pdf)
- Figure 3.2-7a: TPC Background : reconstructed tracks (rz) (.pdf)
- Figure 3.2-7b: TPC Background : reconstructed tracks (rphi) (.pdf)
- Figure 3.2-8a: VTX Background : ghost tracks (.eps) (.pdf) (.gif) (.C)
- Figure 3.2-8b: VTX Background : ghost tracks after BX identification (.eps) (.pdf) (.gif) (.C)
- Figure 3.2-9a: VTX Background : tracking efficiency (.eps) (.pdf) (.gif) (.C)
- Figure 3.2-9b: VTX Background : tracking efficiency for tracks which reach TPC (.eps) (.pdf) (.gif) (.C)
- Figure 3.2-10: Recoil mass with background (.eps) (.pdf) (.gif) (.C)
- Figure 3.2-11a: ILD Flavour tag effic. vs. purity (91 GeV) (.eps) (.pdf) (.gif) (.C)
- Figure 3.2-11b: ILD Flavour tag effic. vs. purity (500 GeV) (.eps) (.pdf) (.gif) (.C)
- Figure 3.2-12: ILD Particle Flow (.eps) (.pdf) (.gif) (.C)
- Figure 3.3-13a: ILD Higgs recoil mass (mumuX) (.eps) (.pdf) (.gif) (.C)
- Figure 3.3-13b: ILD Higgs recoil mass (eeX) (.eps) (.pdf) (.gif) (.C)
- Figure 3.3-14a: ILD Higgs recoil mass (eeX no Brem/No Brem) (.eps) (.pdf) (.gif) (.C)
- Figure 3.3-14b: ILD Higgs recoil mass (eeX with Brem recocovery) (.eps) (.pdf) (.gif) (.C)
- Figure 3.3-15: generated vs. reconstructed mumuX recoil mass (.eps) (.pdf) (.gif) (.C)
- Figure 3.3-16: Higgs BR templates (.eps) (.pdf) (.gif) (.C)
- Figure 3.3-17a: Higgs BR qqcc (.eps) (.pdf) (.gif) (.C)
- Figure 3.3-17b: Higgs BR qqvv (.eps) (.pdf) (.gif) (.C)
- Figure 3.3-18a: 1-prong tau mass (.eps) (.pdf) (.gif) (.C)
- Figure 3.3-18a: Ptau (tau->pi) (.eps) (.pdf) (.gif) (.C)
- Figure 3.3-19a: SUSY Point 5: mass distribution (.eps) (.pdf) (.gif) (.C)
- Figure 3.3-19b: SUSY Point 5: fitted mass distribution (.eps) (.pdf) (.gif) (.C)
- Figure 3.3-19c: SUSY Point 5: W boson energy (.eps) (.pdf) (.gif) (.C)
- Figure 3.3-19d: SUSY Point 5: Z boson energy (.eps) (.pdf) (.gif) (.C)
- Figure 3.3-20a: Top mass (fully-hadronic) (.eps) (.pdf) (.gif) (.C)
- Figure 3.3-20b: Top mass (semi-leptonic) (.eps) (.pdf) (.gif) (.C)
- Figure 3.3-21: Top quark AFB (.eps) (.pdf) (.gif) (.C)
- Figure 3.3-22a: WWvv/ZZvv mass plot (2D) (.eps) (.pdf) (.gif) (.C)
- Figure 3.3-22b: WWvv/ZZvv average mass plot (.eps) (.pdf) (.gif) (.C)
- Figure 3.3-23a: SPS1a' muon momentum (.eps) (.pdf) (.gif) (.C)
- Figure 3.3-23b: SPS1a' di-muon mass (.eps) (.pdf) (.gif) (.C)
- Figure 3.3-24a: SPS1a' stau mass (.eps) (.pdf) (.gif) (.C)
- Figure 3.3-24b: SPS1a' stau spectrum (.eps) (.pdf) (.gif) (.C)
- Figure 3-1a black and white (PFA paper version) ILD Quadrant: (.eps) (.gif) (.C)