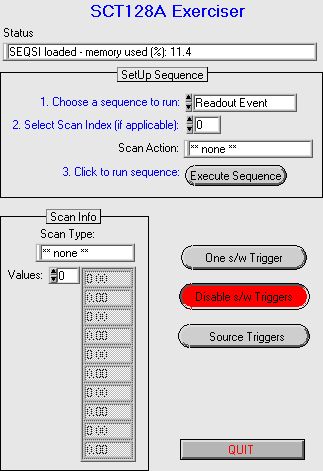
This vi is very useful for interactive debugging, the panel is show below:
In the SetupSequence, you can run any of the following:
- idle loop
- hard chip reset
- set calibrate line
- run chip setup
- run a pedestal event
- send a "soft" reset
- run a scan point (choose any one of 10 scan points in a strobe or
gain or T1 scan)
- run a "readout" event
You can run a sequence once, or continuously (with software generate
trigs or real sourve triggers).
Eg to setup a chip and see the data train on a scope:
- start the vi
- choose a source or cal run (or setup a strobe or gain or T1 scan)
when prompted
- run reset sequence (select "reset" sequence, and click on "Execute
Sequence" button)
- run chip setip sequence
- run readout sequence
- click on "Continuous s/w Triggers" or "Source Triggers"
runDAQ.vi
Full DAQ system. The user can set up any of the following run modes:
- Calibrates run for a given cal size (fC) on a given cal line (0-3)
- Source run, with or without TDC cuts. At the beginning of the source
run there is a short burst (~100 evts)
of calibrates so the gain of the chip can be checked.
- Strobe delay scan from 0 to 25ns (max 10 steps), use with calibrate
runs
- Gain scan, eg from 1fC to 10fC cals
- T1 scan, for signal hunting
You can save the data to disk and generate histos if requested.
The user is first prompted for the required run modes and associated parameters:
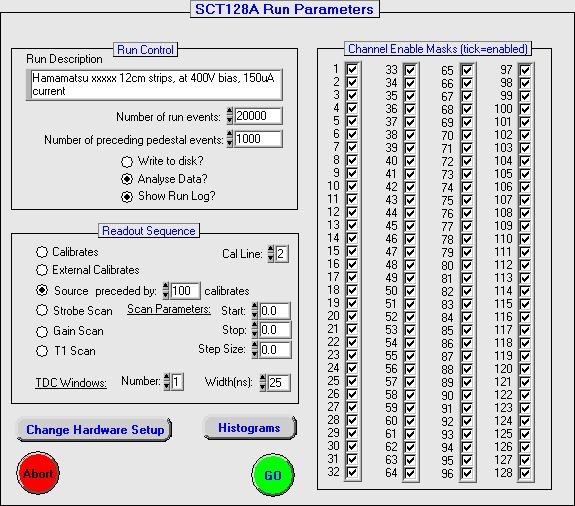
At the start of every run, 1000 events are taken for pedestal/rms noise
calculation. Run events is the number
of events after this initial 1000 pedestal events.
Most options should be obvious. The TDC Windows allows you to plot
signal and signal noise for different window
widths
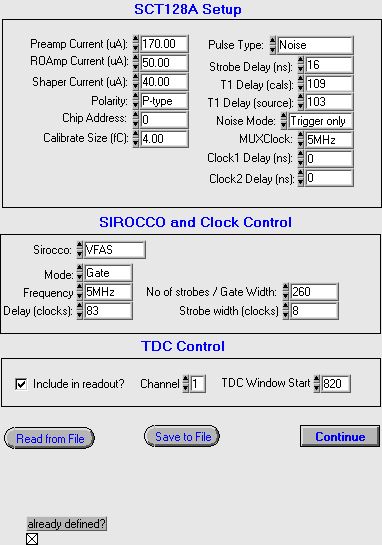
Change Hardware Setup allows you to modify chip parameters (eg DAC
settings, readout speed etc), as
well as sirocco strobe mode (eg,do you want the seqsi to generate a
GATE or strobes to the sirocco? I generate
a GATE and use the 40MHz clock GATEd by this signal to generate the
strobes as I read out at 5Mhz, not 40MHz),
and TDC parameters, eg the start point of the TDC windows. This info
is read from a file for default settings, you
can change these setting and save to another a file:
Histograms allows you to change the histogram binning and ranges.
This is the run console, showing a signal from a beta (ch 47). Channel
102 is dead.
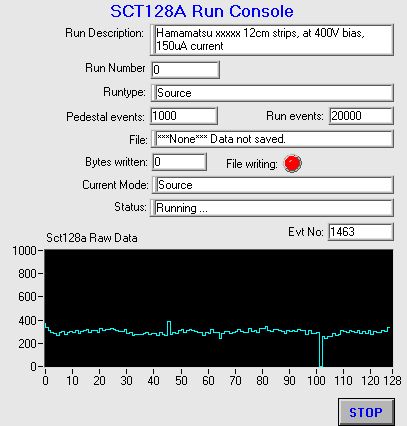
If you selected the "Analyse Data" option, the console calls the event
processor for every event.
The event processor is shown below - it calculates and histograms the
peds, rms common mode corrected
noise, the common mode, the signal, the signal/noise, cluster size,
TDC distribution etc.
For the signal and signal/noise, all source data is shown in yellow,
the data corresponding to
TDC cuts is shown in other colours
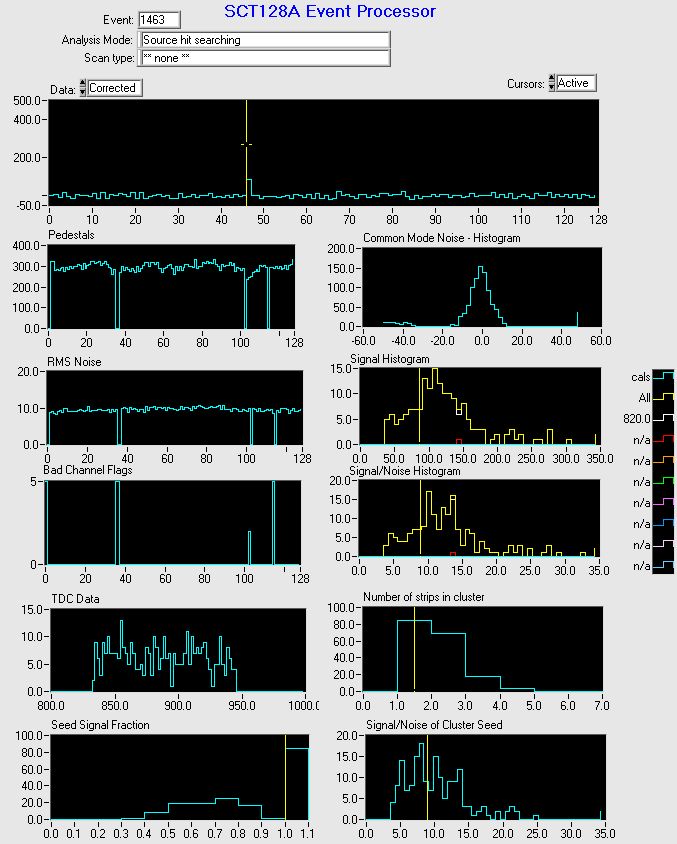
The raw data will be saved to disk if requested by the user, and the
histograms will also be saved to disk (if requested).
ReadHistos.vi
This vi allows you to re-inspect the histograms in greater detail, after they have been saved to disk:
Sorry no image.
ReadData.vi
Sorry no image.
This vi reads the raw data from disk and runs the event processor on
each event, as if taking the data for "real".